


注意
点击此处下载完整的示例代码
PyTorch Profiler
创建日期:2021 年 1 月 29 日 | 最后更新:2024 年 10 月 31 日 | 最后验证:未验证
本篇 cookbook 解释了如何使用 PyTorch profiler 并测量模型算子的时间和内存消耗。
引言
PyTorch 包含一个简单的 profiler API,当用户需要确定模型中最耗时的算子时非常有用。
在本篇 cookbook 中,我们将使用一个简单的 Resnet 模型来演示如何使用 profiler 分析模型性能。
安装
安装 torch 和 torchvision 请使用以下命令
pip install torch torchvision
步骤
导入所有必要的库
实例化一个简单的 Resnet 模型
使用 profiler 分析执行时间
使用 profiler 分析内存消耗
使用跟踪功能
检查堆栈跟踪
使用 profiler 分析长时间运行的任务
1. 导入所有必要的库
在本篇 cookbook 中,我们将使用 torch, torchvision.models 和 profiler 模块
import torch
import torchvision.models as models
from torch.profiler import profile, record_function, ProfilerActivity
2. 实例化一个简单的 Resnet 模型
让我们创建一个 Resnet 模型实例并准备输入
model = models.resnet18()
inputs = torch.randn(5, 3, 224, 224)
3. 使用 profiler 分析执行时间
PyTorch profiler 通过上下文管理器启用,并接受多个参数,其中一些最常用的参数是
activities- 要进行性能分析的活动列表ProfilerActivity.CPU- PyTorch 算子、TorchScript 函数和用户定义的代码标签(参见下面的record_function);ProfilerActivity.CUDA- 设备上的 CUDA 内核;ProfilerActivity.XPU- 设备上的 XPU 内核;
record_shapes- 是否记录算子输入的形状;profile_memory- 是否报告模型张量消耗的内存量;
注意:使用 CUDA 时,profiler 还会显示主机上发生的运行时 CUDA 事件。
让我们看看如何使用 profiler 分析执行时间
with profile(activities=[ProfilerActivity.CPU], record_shapes=True) as prof:
    with record_function("model_inference"):
        model(inputs)
请注意,我们可以使用 record_function 上下文管理器为任意代码范围标记用户提供的名称(在上面的示例中,model_inference 用作标签)。
Profiler 允许检查在 profiler 上下文管理器包装的代码范围内执行期间调用了哪些算子。如果同时有多个 profiler 范围处于活动状态(例如,在并行的 PyTorch 线程中),每个性能分析上下文管理器只会跟踪其相应范围内的算子。Profiler 还会自动分析使用 torch.jit._fork 启动的异步任务,以及(在反向传播的情况下)使用 backward() 调用启动的反向传播算子。
让我们打印出上面执行的统计信息
print(prof.key_averages().table(sort_by="cpu_time_total", row_limit=10))
输出将如下所示(省略了部分列)
# ---------------------------------  ------------  ------------  ------------  ------------
#                              Name      Self CPU     CPU total  CPU time avg    # of Calls
# ---------------------------------  ------------  ------------  ------------  ------------
#                   model_inference       5.509ms      57.503ms      57.503ms             1
#                      aten::conv2d     231.000us      31.931ms       1.597ms            20
#                 aten::convolution     250.000us      31.700ms       1.585ms            20
#                aten::_convolution     336.000us      31.450ms       1.573ms            20
#          aten::mkldnn_convolution      30.838ms      31.114ms       1.556ms            20
#                  aten::batch_norm     211.000us      14.693ms     734.650us            20
#      aten::_batch_norm_impl_index     319.000us      14.482ms     724.100us            20
#           aten::native_batch_norm       9.229ms      14.109ms     705.450us            20
#                        aten::mean     332.000us       2.631ms     125.286us            21
#                      aten::select       1.668ms       2.292ms       8.988us           255
# ---------------------------------  ------------  ------------  ------------  ------------
# Self CPU time total: 57.549m
#
这里我们看到,正如预期的那样,大部分时间花费在卷积运算上(特别是对于支持 MKL-DNN 编译的 PyTorch 中的 mkldnn_convolution)。请注意 self cpu time 和 cpu time 的区别 - 算子可以调用其他算子,self cpu time 不包括子算子调用花费的时间,而总 cpu time 包括它。你可以通过将 sort_by="self_cpu_time_total" 传递给 table 调用来选择按 self cpu time 排序。
要获得更细粒度的结果并包含算子输入形状,请传递 group_by_input_shape=True(注意:这需要在运行 profiler 时设置 record_shapes=True)
print(prof.key_averages(group_by_input_shape=True).table(sort_by="cpu_time_total", row_limit=10))
输出可能如下所示(省略了部分列)
---------------------------------  ------------  -------------------------------------------
                             Name     CPU total                                 Input Shapes
---------------------------------  ------------  -------------------------------------------
                  model_inference      57.503ms                                           []
                     aten::conv2d       8.008ms      [5,64,56,56], [64,64,3,3], [], ..., []]
                aten::convolution       7.956ms     [[5,64,56,56], [64,64,3,3], [], ..., []]
               aten::_convolution       7.909ms     [[5,64,56,56], [64,64,3,3], [], ..., []]
         aten::mkldnn_convolution       7.834ms     [[5,64,56,56], [64,64,3,3], [], ..., []]
                     aten::conv2d       6.332ms    [[5,512,7,7], [512,512,3,3], [], ..., []]
                aten::convolution       6.303ms    [[5,512,7,7], [512,512,3,3], [], ..., []]
               aten::_convolution       6.273ms    [[5,512,7,7], [512,512,3,3], [], ..., []]
         aten::mkldnn_convolution       6.233ms    [[5,512,7,7], [512,512,3,3], [], ..., []]
                     aten::conv2d       4.751ms  [[5,256,14,14], [256,256,3,3], [], ..., []]
---------------------------------  ------------  -------------------------------------------
Self CPU time total: 57.549ms
注意 aten::convolution 出现了两次,输入形状不同。
Profiler 还可以用于分析在 GPU 和 XPU 上执行的模型性能:用户可以在 cpu, cuda 和 xpu 之间切换
if torch.cuda.is_available():
    device = 'cuda'
elif torch.xpu.is_available():
    device = 'xpu'
else:
    print('Neither CUDA nor XPU devices are available to demonstrate profiling on acceleration devices')
    import sys
    sys.exit(0)

activities = [ProfilerActivity.CPU, ProfilerActivity.CUDA, ProfilerActivity.XPU]
sort_by_keyword = device + "_time_total"

model = models.resnet18().to(device)
inputs = torch.randn(5, 3, 224, 224).to(device)

with profile(activities=activities, record_shapes=True) as prof:
    with record_function("model_inference"):
        model(inputs)

print(prof.key_averages().table(sort_by=sort_by_keyword, row_limit=10))
(注意:首次使用 CUDA 性能分析可能会带来额外的开销。)
生成的表格输出(省略了部分列)
-------------------------------------------------------  ------------  ------------
                                                   Name     Self CUDA    CUDA total
-------------------------------------------------------  ------------  ------------
                                        model_inference       0.000us      11.666ms
                                           aten::conv2d       0.000us      10.484ms
                                      aten::convolution       0.000us      10.484ms
                                     aten::_convolution       0.000us      10.484ms
                             aten::_convolution_nogroup       0.000us      10.484ms
                                      aten::thnn_conv2d       0.000us      10.484ms
                              aten::thnn_conv2d_forward      10.484ms      10.484ms
void at::native::im2col_kernel<float>(long, float co...       3.844ms       3.844ms
                                      sgemm_32x32x32_NN       3.206ms       3.206ms
                                  sgemm_32x32x32_NN_vec       3.093ms       3.093ms
-------------------------------------------------------  ------------  ------------
Self CPU time total: 23.015ms
Self CUDA time total: 11.666ms
(注意:首次使用 XPU 性能分析可能会带来额外的开销。)
生成的表格输出(省略了部分列)
- ——————————————————- ———— ———— ———— ———— ————
名称 Self XPU Self XPU % XPU total XPU time avg # of Calls
- ——————————————————- ———— ———— ———— ———— ————
- model_inference 0.000us 0.00% 2.567ms 2.567ms 1
aten::conv2d 0.000us 0.00% 1.871ms 93.560us 20
aten::convolution 0.000us 0.00% 1.871ms 93.560us 20
aten::_convolution 0.000us 0.00% 1.871ms 93.560us 20
- aten::convolution_overrideable 1.871ms 72.89% 1.871ms 93.560us 20
gen_conv 1.484ms 57.82% 1.484ms 74.216us 20
aten::batch_norm 0.000us 0.00% 432.640us 21.632us 20
- aten::_batch_norm_impl_index 0.000us 0.00% 432.640us 21.632us 20
- aten::native_batch_norm 432.640us 16.85% 432.640us 21.632us 20
conv_reorder 386.880us 15.07% 386.880us 6.448us 60
——————————————————- ———— ———— ———— ———— ———— Self CPU time total: 712.486ms Self XPU time total: 2.567ms
#
注意输出中出现了设备上的内核(例如 sgemm_32x32x32_NN)。
4. 使用 profiler 分析内存消耗
PyTorch profiler 还可以显示在执行模型算子期间分配(或释放)的内存量(由模型张量使用)。在下面的输出中,'self' memory 对应于算子分配(释放)的内存,不包括对其他算子的子调用。要启用内存性能分析功能,请传递 profile_memory=True。
model = models.resnet18()
inputs = torch.randn(5, 3, 224, 224)

with profile(activities=[ProfilerActivity.CPU],
        profile_memory=True, record_shapes=True) as prof:
    model(inputs)

print(prof.key_averages().table(sort_by="self_cpu_memory_usage", row_limit=10))

# (omitting some columns)
# ---------------------------------  ------------  ------------  ------------
#                              Name       CPU Mem  Self CPU Mem    # of Calls
# ---------------------------------  ------------  ------------  ------------
#                       aten::empty      94.79 Mb      94.79 Mb           121
#     aten::max_pool2d_with_indices      11.48 Mb      11.48 Mb             1
#                       aten::addmm      19.53 Kb      19.53 Kb             1
#               aten::empty_strided         572 b         572 b            25
#                     aten::resize_         240 b         240 b             6
#                         aten::abs         480 b         240 b             4
#                         aten::add         160 b         160 b            20
#               aten::masked_select         120 b         112 b             1
#                          aten::ne         122 b          53 b             6
#                          aten::eq          60 b          30 b             2
# ---------------------------------  ------------  ------------  ------------
# Self CPU time total: 53.064ms

print(prof.key_averages().table(sort_by="cpu_memory_usage", row_limit=10))
输出可能如下所示(省略了部分列)
---------------------------------  ------------  ------------  ------------
                             Name       CPU Mem  Self CPU Mem    # of Calls
---------------------------------  ------------  ------------  ------------
                      aten::empty      94.79 Mb      94.79 Mb           121
                 aten::batch_norm      47.41 Mb           0 b            20
     aten::_batch_norm_impl_index      47.41 Mb           0 b            20
          aten::native_batch_norm      47.41 Mb           0 b            20
                     aten::conv2d      47.37 Mb           0 b            20
                aten::convolution      47.37 Mb           0 b            20
               aten::_convolution      47.37 Mb           0 b            20
         aten::mkldnn_convolution      47.37 Mb           0 b            20
                 aten::max_pool2d      11.48 Mb           0 b             1
    aten::max_pool2d_with_indices      11.48 Mb      11.48 Mb             1
---------------------------------  ------------  ------------  ------------
Self CPU time total: 53.064ms
5. 使用跟踪功能
性能分析结果可以输出为 .json 跟踪文件:跟踪 CUDA 或 XPU 内核,用户可以在 cpu, cuda 和 xpu 之间切换
device = 'cuda'

activities = [ProfilerActivity.CPU, ProfilerActivity.CUDA, ProfilerActivity.XPU]

model = models.resnet18().to(device)
inputs = torch.randn(5, 3, 224, 224).to(device)

with profile(activities=activities) as prof:
    model(inputs)

prof.export_chrome_trace("trace.json")
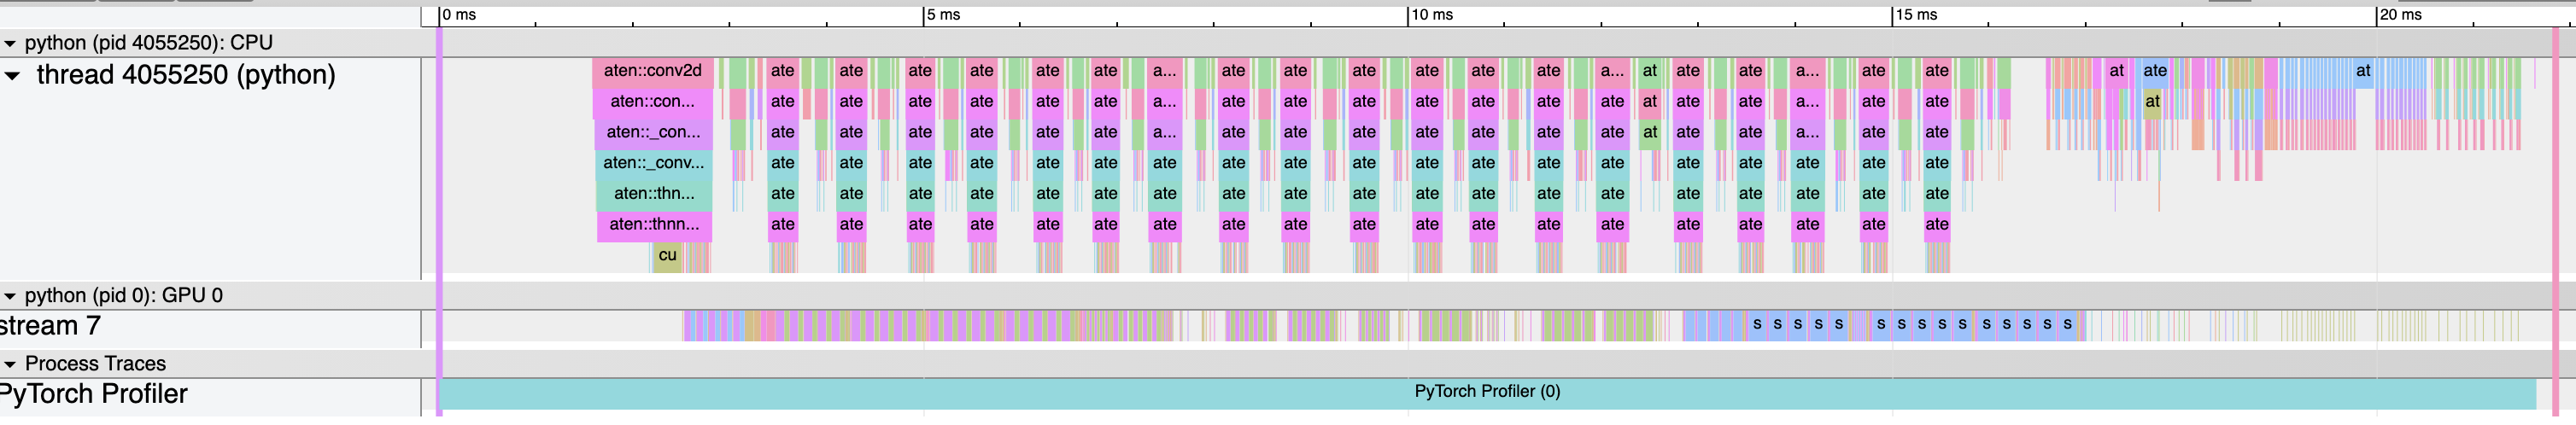
您可以在 Chrome 跟踪查看器 (chrome://tracing) 中查看被分析的算子和 CUDA/XPU 内核序列
6. 检查堆栈跟踪
Profiler 可用于分析 Python 和 TorchScript 堆栈跟踪
sort_by_keyword = "self_" + device + "_time_total"

with profile(
    activities=activities,
    with_stack=True,
) as prof:
    model(inputs)

# Print aggregated stats
print(prof.key_averages(group_by_stack_n=5).table(sort_by=sort_by_keyword, row_limit=2))
输出可能如下所示(省略了部分列)
-------------------------  -----------------------------------------------------------
                     Name  Source Location
-------------------------  -----------------------------------------------------------
aten::thnn_conv2d_forward  .../torch/nn/modules/conv.py(439): _conv_forward
                           .../torch/nn/modules/conv.py(443): forward
                           .../torch/nn/modules/module.py(1051): _call_impl
                           .../site-packages/torchvision/models/resnet.py(63): forward
                           .../torch/nn/modules/module.py(1051): _call_impl
aten::thnn_conv2d_forward  .../torch/nn/modules/conv.py(439): _conv_forward
                           .../torch/nn/modules/conv.py(443): forward
                           .../torch/nn/modules/module.py(1051): _call_impl
                           .../site-packages/torchvision/models/resnet.py(59): forward
                           .../torch/nn/modules/module.py(1051): _call_impl
-------------------------  -----------------------------------------------------------
Self CPU time total: 34.016ms
Self CUDA time total: 11.659ms
注意 torchvision/models/resnet.py 脚本中的两个卷积和两个调用点。
(警告:堆栈跟踪会增加额外的性能分析开销。)
7. 使用 profiler 分析长时间运行的任务
PyTorch profiler 提供了一个额外的 API 来处理长时间运行的任务(如训练循环)。跟踪所有执行可能很慢,并产生非常大的跟踪文件。为了避免这种情况,请使用可选参数
schedule- 指定一个函数,该函数接受一个整数参数(步数)作为输入,并返回一个 profiler 操作,使用此参数的最佳方式是使用torch.profiler.schedule辅助函数,它可以为您生成一个计划;on_trace_ready- 指定一个函数,该函数接受 profiler 的引用作为输入,并在每次新的跟踪准备就绪时由 profiler 调用。
为了说明此 API 的工作原理,我们首先考虑下面使用 torch.profiler.schedule 辅助函数的示例
Profiler 假定长时间运行的任务由多个步骤组成,编号从零开始。上面的示例为 profiler 定义了以下一系列操作
参数
skip_first告诉 profiler 应该忽略前 10 步(skip_first的默认值为零);在前
skip_first步之后,profiler 开始执行 profiler 周期;每个周期包含三个阶段
空闲 (
wait=5步),在此阶段 profiler 不活跃;预热 (
warmup=1步),在此阶段 profiler 开始跟踪,但结果被丢弃;此阶段用于丢弃 profiler 在跟踪开始时获得的样本,因为这些样本通常会因额外的开销而失真;活动跟踪 (
active=3步),在此阶段 profiler 进行跟踪并记录数据;
可选的
repeat参数指定了周期数的上限。默认情况下(值为零),profiler 会在任务运行期间持续执行周期。
因此,在上面的示例中,profiler 将跳过前 15 步,在接下来的 1 步进行预热,积极记录接下来的 3 步,跳过另外 5 步,在接下来的 1 步进行预热,再积极记录 3 步。由于指定了 repeat=2 参数值,profiler 将在执行完前两个周期后停止记录。
在每个周期结束时,profiler 调用指定的 on_trace_ready 函数,并将自身作为参数传递。此函数用于处理新的跟踪 - 可以通过获取表格输出,也可以通过将输出保存到磁盘作为跟踪文件。
要向 profiler 发送信号表示下一阶段已开始,请调用 prof.step() 函数。当前的 profiler 步数存储在 prof.step_num 中。
以下示例展示了如何在 CUDA 和 XPU 内核上使用上述所有概念
sort_by_keyword = "self_" + device + "_time_total"

def trace_handler(p):
    output = p.key_averages().table(sort_by=sort_by_keyword, row_limit=10)
    print(output)
    p.export_chrome_trace("/tmp/trace_" + str(p.step_num) + ".json")

with profile(
    activities=activities,
    schedule=torch.profiler.schedule(
        wait=1,
        warmup=1,
        active=2),
    on_trace_ready=trace_handler
) as p:
    for idx in range(8):
        model(inputs)
        p.step()
了解更多
查看以下 cookbook/教程以继续您的学习
脚本总运行时间: ( 0 分 0.000 秒)
