这是“了解 GPU 内存”博客系列的第 2 部分。我们的第一篇文章了解 GPU 内存 1:可视化所有随时间变化的分配展示了如何使用内存快照工具。在本部分中,我们将使用内存快照来可视化由循环引用导致的 GPU 内存泄漏,然后使用引用循环检测器在我们的代码中定位并移除它们。
有时,当我们使用内存快照时,会看到类似于此的 GPU 内存图。
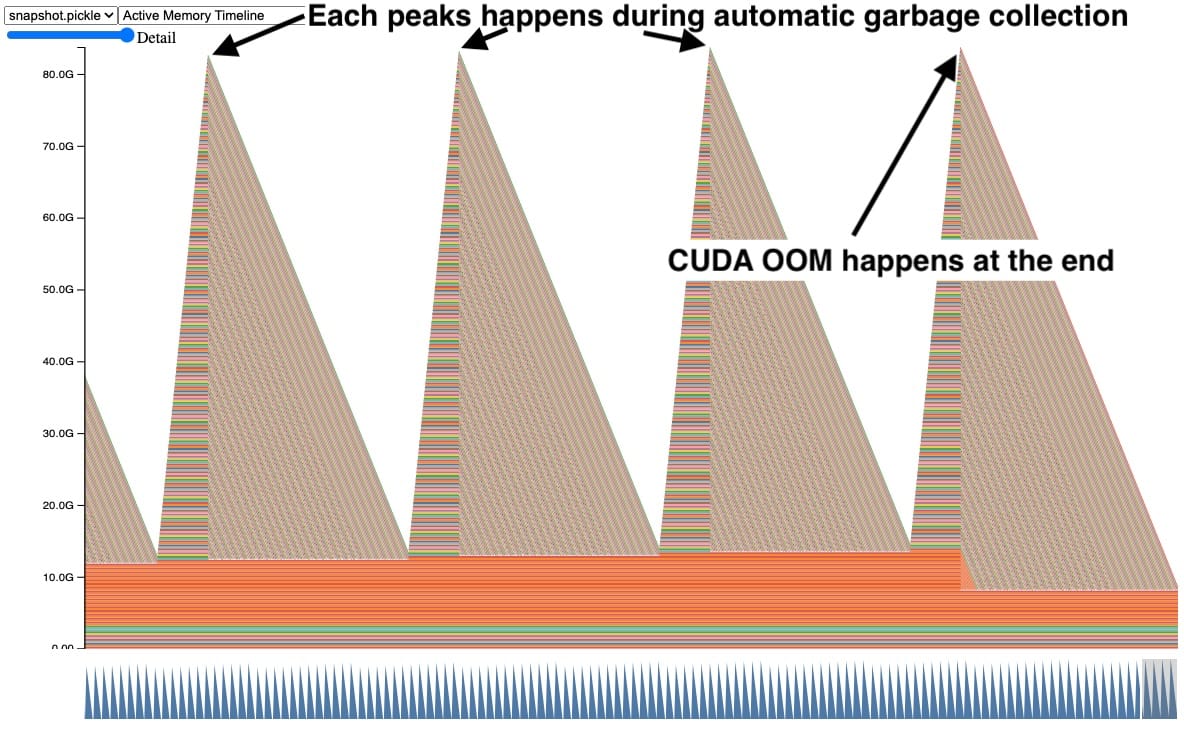
在此快照中,每个峰值都显示 GPU 张量随时间累积,然后多个张量同时释放。此外,右侧发生了 CUDA OOM,导致所有张量都被释放。看到张量以这种方式累积是一个明确的问题迹象,但它并没有立即说明原因。
循环引用中的张量
在早期调试过程中,我们深入研究发现,当您的 Python 代码具有带引用循环的对象时,这种模式经常发生。Python 会使用引用计数立即清理非循环对象。但是,循环引用中的对象只有在循环收集器运行后才会被清理。如果这些循环引用 GPU 张量,那么 GPU 张量将一直存在,直到该循环收集器运行并移除引用循环。让我们看一个简化的示例。
快照背后的代码片段(完整代码见附录 A)
    def leak(tensor_size, num_iter=100000, device="cuda:0"):
      class Node:
        def __init__(self, T):
          self.tensor = T
          self.link = None

      for _ in range(num_iter):
        A = torch.zeros(tensor_size, device=device)
        B = torch.zeros(tensor_size, device=device)
        a, b = Node(A), Node(B)

        # A reference cycle will force refcounts to be non-zero.
        a.link, b.link = b, a
        # Python will eventually garbage collect a & b, but will
        # OOM on the GPU before that happens (since python
        # runtime doesn't know about CUDA memory usage).
在此代码示例中,创建了张量 A 和 B,其中 A 链接到 B,反之亦然。这会强制在 A 和 B 超出范围时引用计数非零。当我们运行 100,000 次迭代时,我们期望自动垃圾收集在超出范围时释放引用循环。然而,这实际上会导致 CUDA OOM。
为什么自动垃圾收集不起作用?
自动垃圾收集在内存充足时(如 CPU 上常见)效果很好,因为它通过使用分代垃圾收集来分摊昂贵的垃圾收集成本。但是为了分摊收集工作,它会推迟一些内存清理,从而导致最大内存使用量更高,这不太适合内存受限的环境。Python 运行时也无法洞察 CUDA 内存使用情况,因此它也无法在高内存压力下触发。由于 GPU 训练几乎总是内存受限的,因为我们经常会提高批处理大小以利用任何额外的可用内存,因此这更具挑战性。
CPython 的垃圾收集通过标记-清除来释放循环引用中持有的不可达对象。当对象数量超过特定阈值时,垃圾收集会自动运行。有三代阈值,以帮助分摊在每个对象上运行垃圾收集的昂贵成本。后期代运行频率较低。这解释了为什么自动收集只会在每个峰值处清除几个张量,但仍然有张量泄漏导致 CUDA OOM。这些张量是由后期代中的循环引用持有的。
显式调用 gc.collect()
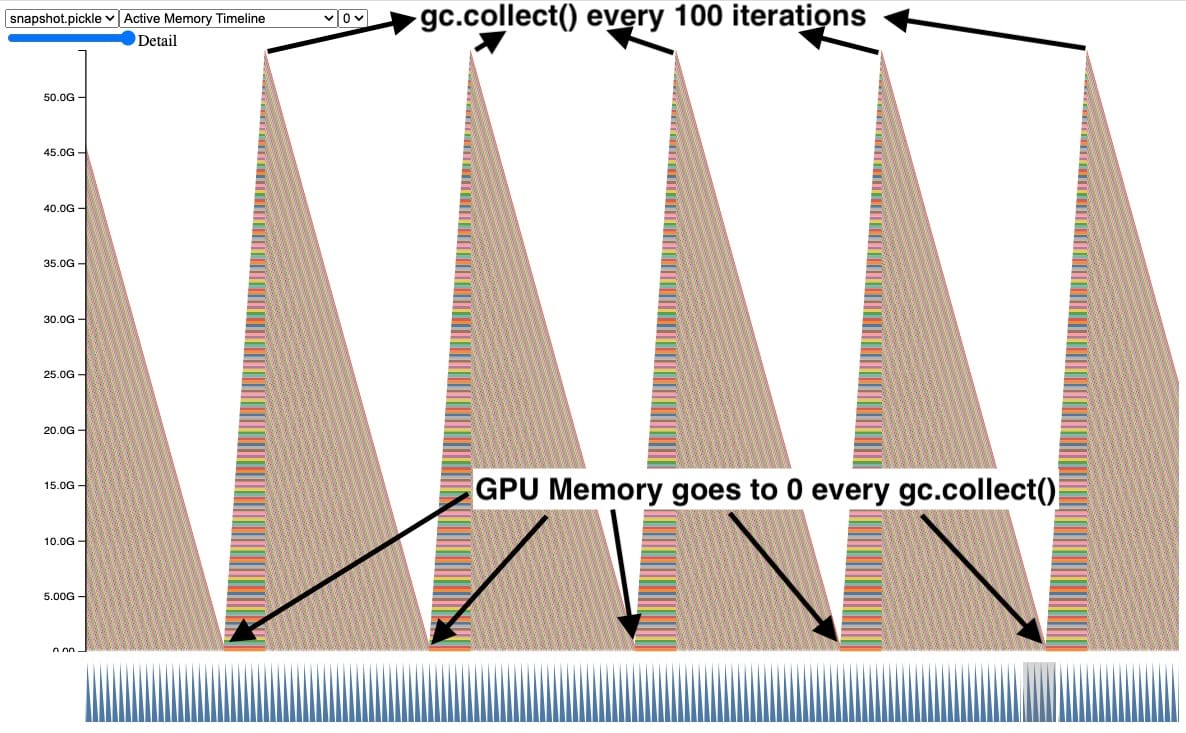
解决这个问题的一种方法是频繁地显式调用垃圾收集器。在这里我们可以看到,当我们每 100 次迭代显式调用垃圾收集器时,超出范围的张量的 GPU 内存会被清理。这还控制了泄漏张量所持有的最大 GPU 峰值内存。
尽管这有效并解决了 CUDA OOM 问题,但过于频繁地调用 gc.collect() 可能会导致其他问题,包括 QPS 回归。因此,我们不能简单地增加每个训练作业的垃圾收集频率。最好是首先避免创建引用循环。有关更多信息,请参阅“引用循环检测器”部分。
回调中的隐蔽内存泄漏
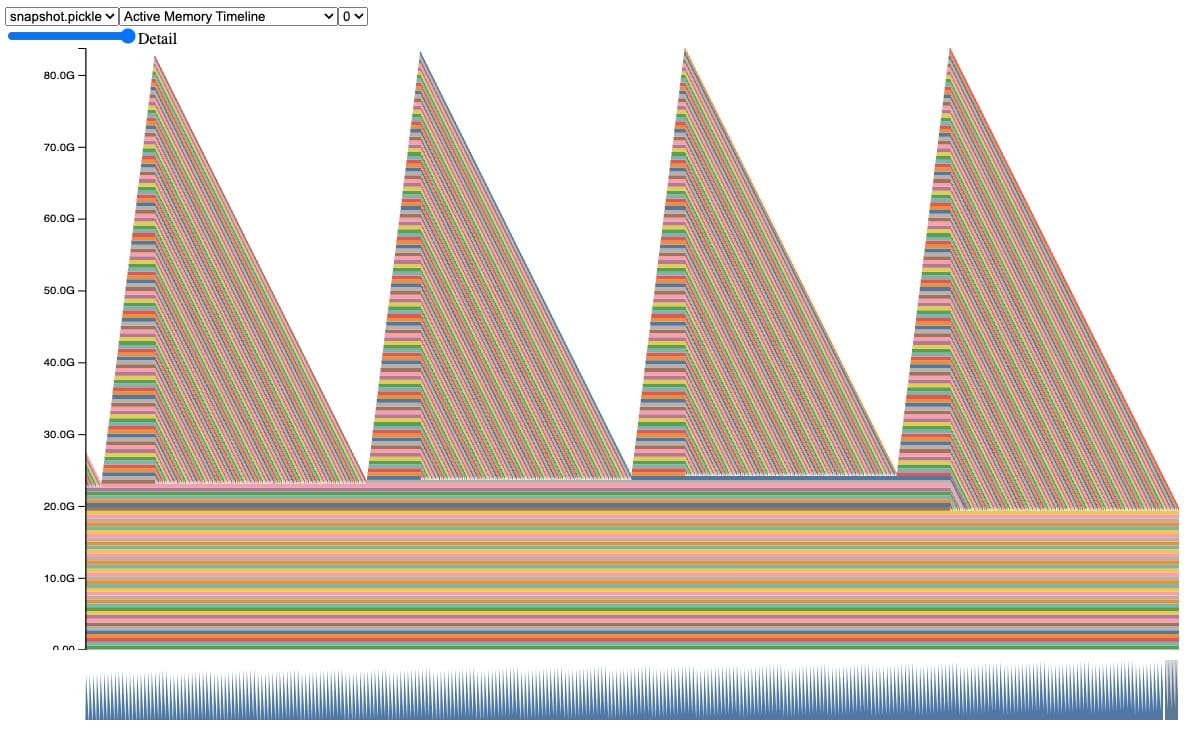
真实的例子更复杂,所以让我们看一个具有类似行为的更现实的例子。在这个快照中,我们可以观察到张量在自动垃圾收集过程中累积和释放的相同行为,直到我们遇到 CUDA OOM。
此快照背后的代码片段(完整代码示例见附录 A)
    class AwaitableTensor:
      def __init__(self, tensor_size):
        self._tensor_size = tensor_size
        self._tensor = None

      def wait(self):
        self._tensor = torch.zeros(self._tensor_size, device="cuda:0")
        return self._tensor

    class AwaitableTensorWithViewCallback:
      def __init__(self, tensor_awaitable, view_dim):
        self._tensor_awaitable = tensor_awaitable
        self._view_dim = view_dim
        # Add a view filter callback to the tensor.
        self._callback = lambda ret: ret.view(-1, self._view_dim)

      def wait(self):
        return self._callback(self._tensor_awaitable.wait())

    async def awaitable_leak(
      tensor_size=2**27, num_iter=100000,
    ):
      for _ in range(num_iter):
        A = AwaitableTensor(tensor_size)
        AwaitableTensorWithViewCallBack(A, 4).wait()
在这段代码中,我们定义了两个类。AwaitableTensor 类在被等待时会创建一个张量。另一个类 AwaitableTensorWithViewCallback 将通过回调 lambda 在 AwaitableTensor 上应用视图过滤器。
当运行 awaitable_leak(它创建张量 A(512 MB)并应用视图过滤器 100,000 次迭代)时,我们期望 A 每次超出作用域时都会被回收,因为引用计数应该达到 0。然而,这实际上会导致 OOM!
虽然我们知道这里存在一个引用循环,但从代码中并不清楚循环是在哪里创建的。为了帮助解决这些情况,我们创建了一个工具来定位和报告这些循环。
引用循环检测器
介绍引用循环检测器,它帮助我们找到使 GPU 张量保持活动的引用循环。API 相当简单:
- 在模型初始化期间
- 导入:
from torch.utils.viz._cycles import warn_tensor_cycles - 开始:
warn_tensor_cycles()
- 导入:
每当循环收集器运行并发现一个被释放的 CUDA 张量时,引用循环检测器就会发出警告。该警告提供一个对象图,显示引用循环如何引用 GPU 张量。
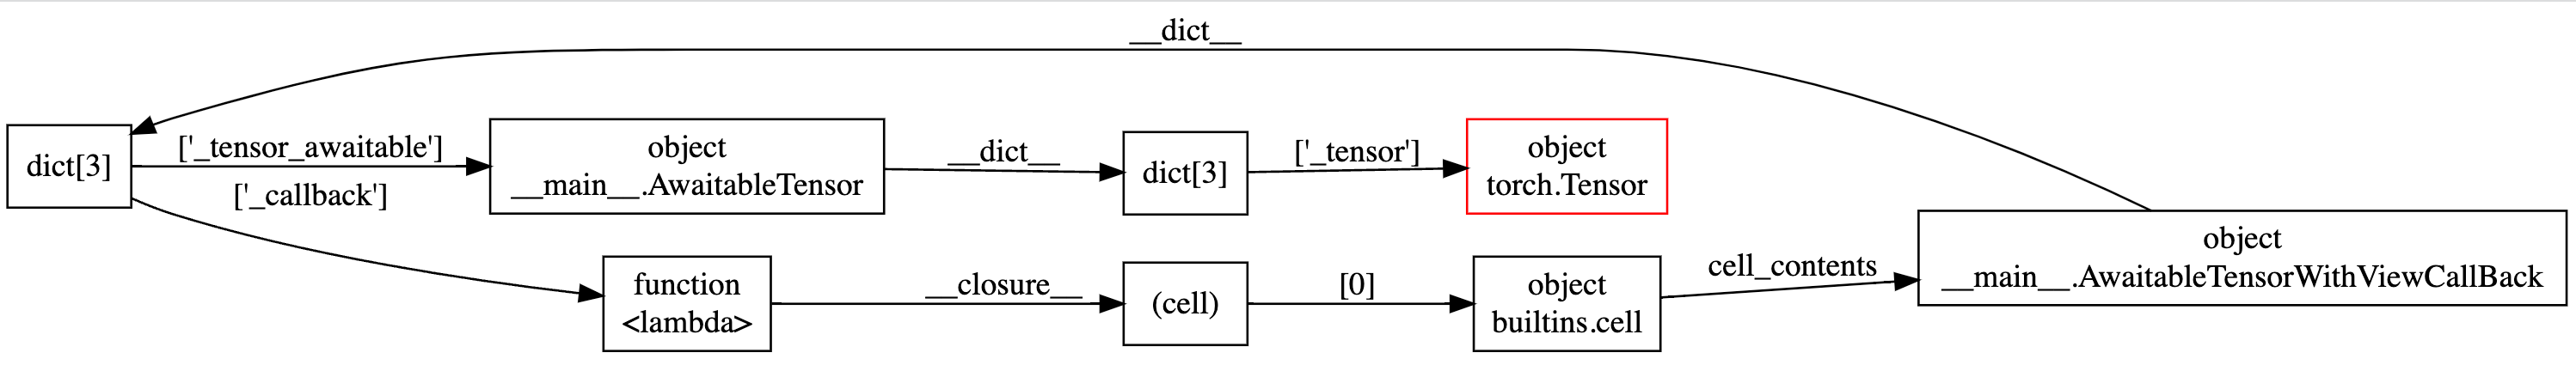
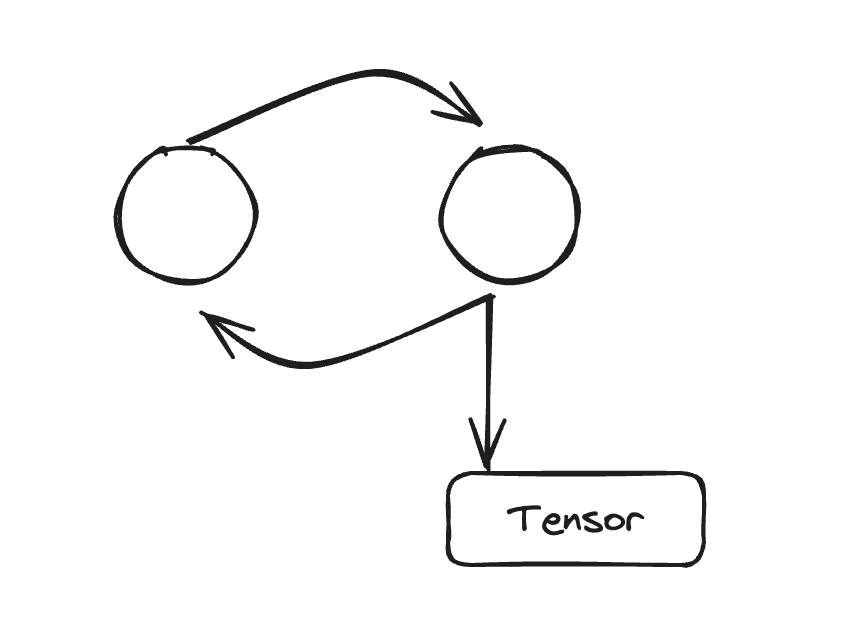
例如,在这个对象图中,我们可以很容易地观察到在图的外圈存在循环依赖,并且红色突出显示的是保持活动的 GPU 张量。
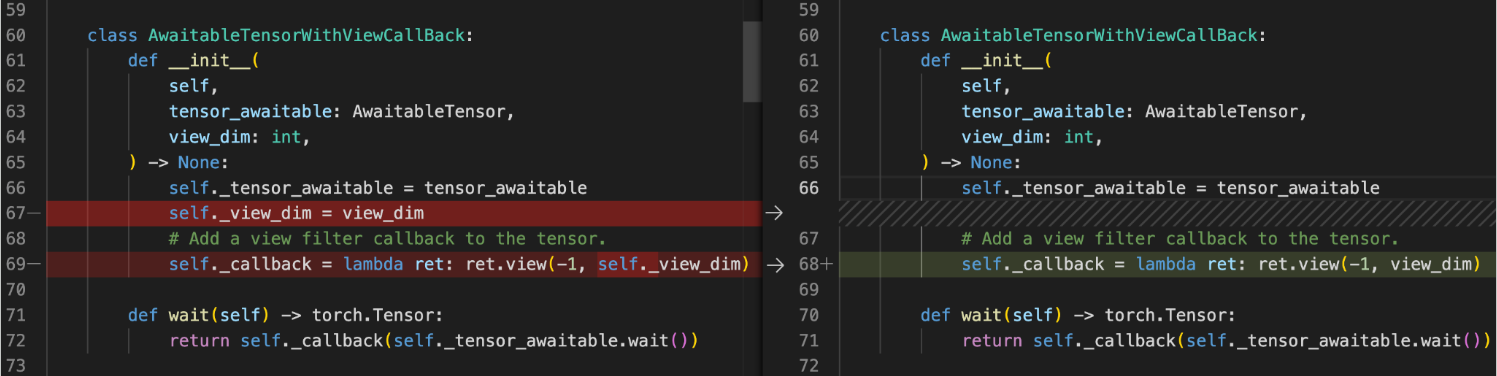
大多数循环一旦被发现就很容易修复。例如,在这里我们可以移除回调中 self._view_dim 创建的对 self 的引用。
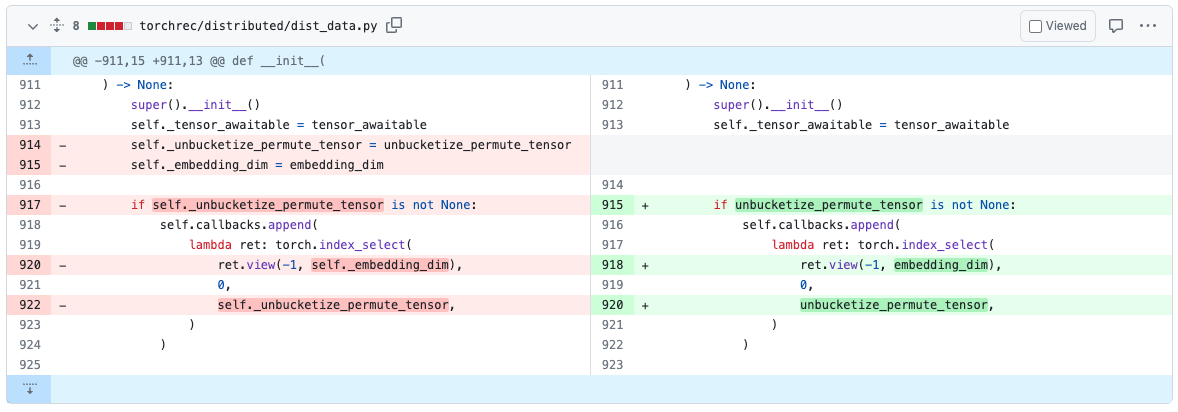
我们已经花了一些时间使用这些工具来修复现有模型中的循环。例如,在 TorchRec 中,我们已经在 PR#1226 中找到了并移除了一个引用循环。
一旦我们移除了引用循环,代码将不再发出 CUDA OOM 错误,也不会在快照中显示任何内存泄漏。
使用引用循环检测器还有哪些好处?
移除这些循环还将直接降低最大 GPU 内存使用量,并使其更不容易出现内存碎片化,因为分配器在每次迭代后都会返回到相同的状态。
我在哪里可以找到这些工具?
我们希望引用循环检测器能大大提高您发现和移除由引用循环引起的内存泄漏的能力。引用循环检测器在 PyTorch v2.1 版本中作为实验性功能提供,有关引用循环检测器的更多信息可在此处 PyTorch 内存文档中找到。
反馈
我们期待收到您关于我们的工具帮助解决的任何改进、错误或内存故事的反馈!一如既往,请随时在 PyTorch 的 Github 页面上开新问题。
我们也欢迎 OSS 社区的贡献,欢迎在任何 Github PR 中 @ Aaron Shi 和 Zachary DeVito 进行审核。
致谢
非常感谢内容审阅者 Mark Saroufim、Gregory Chanan 和 Adnan Aziz 审阅本文并提高其可读性。
附录
附录 A – 代码示例
此代码片段用于生成所示的图表和示例。以下是重现各部分的参数:
- 介绍:
python sample.py - 显式调用 gc.collect():
python sample.py --gc_collect_interval=100 - 回调中的隐蔽内存泄漏:
python sample.py --workload=awaitable - 引用循环检测器:
python sample.py --workload=awaitable --warn_tensor_cycles
sample.py
# (c) Meta Platforms, Inc. and affiliates.
import argparse
import asyncio
import gc
import logging
import socket
from datetime import datetime, timedelta

import torch

logging.basicConfig(
   format="%(levelname)s:%(asctime)s %(message)s",
   level=logging.INFO,
   datefmt="%Y-%m-%d %H:%M:%S",
)
logger: logging.Logger = logging.getLogger(__name__)
logger.setLevel(level=logging.INFO)

TIME_FORMAT_STR: str = "%b_%d_%H_%M_%S"

# Keep a max of 100,000 alloc/free events in the recorded history
# leading up to the snapshot.
MAX_NUM_OF_MEM_EVENTS_PER_SNAPSHOT: int = 100000

def start_record_memory_history() -> None:
   if not torch.cuda.is_available():
       logger.info("CUDA unavailable. Not recording memory history")
       return

   logger.info("Starting snapshot record_memory_history")
   torch.cuda.memory._record_memory_history(
       max_entries=MAX_NUM_OF_MEM_EVENTS_PER_SNAPSHOT
   )

def stop_record_memory_history() -> None:
   if not torch.cuda.is_available():
       logger.info("CUDA unavailable. Not recording memory history")
       return

   logger.info("Stopping snapshot record_memory_history")
   torch.cuda.memory._record_memory_history(enabled=None)

def export_memory_snapshot() -> None:
   if not torch.cuda.is_available():
       logger.info("CUDA unavailable. Not exporting memory snapshot")
       return

   # Prefix for file names.
   host_name = socket.gethostname()
   timestamp = datetime.now().strftime(TIME_FORMAT_STR)
   file_prefix = f"{host_name}_{timestamp}"

   try:
       logger.info(f"Saving snapshot to local file: {file_prefix}.pickle")
       torch.cuda.memory._dump_snapshot(f"{file_prefix}.pickle")
   except Exception as e:
       logger.error(f"Failed to capture memory snapshot {e}")
       return

# This function will leak tensors due to the reference cycles.
def simple_leak(tensor_size, gc_interval=None, num_iter=30000, device="cuda:0"):
    class Node:
        def __init__(self, T):
            self.tensor = T
            self.link = None

    for i in range(num_iter):
        A = torch.zeros(tensor_size, device=device)
        B = torch.zeros(tensor_size, device=device)
        a, b = Node(A), Node(B)
        # A reference cycle will force refcounts to be non-zero, when
        # a and b go out of scope.
        a.link, b.link = b, a
        # Python will eventually gc a and b, but may OOM on the CUDA
        # device before that happens (since python runtime doesn't
        # know about CUDA memory usage).

        # Since implicit gc is not called frequently enough due to
        # generational gc, adding an explicit gc is necessary as Python
        # runtime does not know about CUDA memory pressure.
        # https://en.wikipedia.org/wiki/Tracing_garbage_collection#Generational_GC_(ephemeral_GC)
        if gc_interval and i % int(gc_interval) == 0:
            gc.collect()

async def awaitable_leak(
    tensor_size, gc_interval=None, num_iter=100000, device="cuda:0"
):
    class AwaitableTensor:
        def __init__(self, tensor_size, device) -> None:
            self._tensor_size = tensor_size
            self._device = device
            self._tensor = None

        def wait(self) -> torch.Tensor:
            self._tensor = torch.zeros(self._tensor_size, device=self._device)
            return self._tensor

    class AwaitableTensorWithViewCallBack:
        def __init__(
            self,
            tensor_awaitable: AwaitableTensor,
            view_dim: int,
        ) -> None:
            self._tensor_awaitable = tensor_awaitable
            self._view_dim = view_dim
            # Add a view filter callback to the tensor.
            self._callback = lambda ret: ret.view(-1, self._view_dim)

        def wait(self) -> torch.Tensor:
            return self._callback(self._tensor_awaitable.wait())

    for i in range(num_iter):
        # Create an awaitable tensor
        a_tensor = AwaitableTensor(tensor_size, device)

        # Apply a view filter callback on the awaitable tensor.
        AwaitableTensorWithViewCallBack(a_tensor, 4).wait()

        # a_tensor will go out of scope.

        if gc_interval and i % int(gc_interval) == 0:
            gc.collect()

if __name__ == "__main__":
    parser = argparse.ArgumentParser(description="A memory_leak binary instance")
    parser.add_argument(
        "--gc_collect_interval",
        default=None,
        help="Explicitly call GC every given interval. Default is off.",
    )
    parser.add_argument(
        "--workload",
        default="simple",
        help="Toggle which memory leak workload to run. Options are simple, awaitable.",
    )
    parser.add_argument(
        "--warn_tensor_cycles",
        action="store_true",
        default=False,
        help="Toggle whether to enable reference cycle detector.",
    )
    args = parser.parse_args()

    if args.warn_tensor_cycles:
        from tempfile import NamedTemporaryFile

        from torch.utils.viz._cycles import observe_tensor_cycles

        logger.info("Enabling warning for Python reference cycles for CUDA Tensors.")

        def write_and_log(html):
            with NamedTemporaryFile("w", suffix=".html", delete=False) as f:
                f.write(html)
                logger.warning(
                    "Reference cycle includes a CUDA Tensor see visualization of cycle %s",
                    f.name,
                )

        observe_tensor_cycles(write_and_log)
    else:
        # Start recording memory snapshot history
        start_record_memory_history()

    # Run the workload with a larger tensor size.
    # For smaller sizes, we will not CUDA OOM as gc will kick in often enough
    # to reclaim reference cycles before an OOM occurs.
    size = 2**26  # 256 MB
    try:
        if args.workload == "awaitable":
            size *= 2
            logger.info(f"Running tensor_size: {size*4/1024/1024} MB")
            asyncio.run(
                awaitable_leak(tensor_size=size, gc_interval=args.gc_collect_interval)
            )
        elif args.workload == "simple":
            logger.info(f"Running tensor_size: {size*4/1024/1024} MB")
            simple_leak(tensor_size=size, gc_interval=args.gc_collect_interval)
        else:
            raise Exception("Unknown workload.")
    except Exception:
        logger.exception(f"Failed to allocate {size*4/1024/1024} MB")

    # Create the memory snapshot file
    export_memory_snapshot()

    # Stop recording memory snapshot history
    stop_record_memory_history()