SSD


模型描述
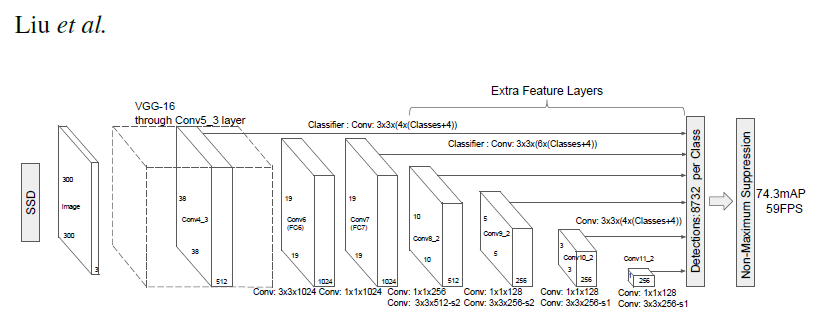
此 SSD300 模型基于《SSD: Single Shot MultiBox Detector》论文,该论文将 SSD 描述为“一种使用单个深度神经网络检测图像中物体的方法”。输入大小固定为 300×300。
此模型与论文中描述的模型的主要区别在于主干网络。具体来说,VGG 模型已过时,并被 ResNet-50 模型取代。
根据《Speed/accuracy trade-offs for modern convolutional object detectors》论文,对主干网络进行了以下增强:
- 原始分类模型中的 conv5_x、avgpool、fc 和 softmax 层已被移除。
- conv4_x 中的所有步幅都设置为 1×1。
主干网络之后是 5 个额外的卷积层。除了卷积层之外,我们还附加了 6 个检测头。
- 第一个检测头连接到最后一个 conv4_x 层。
- 其他五个检测头连接到相应的 5 个额外层。
检测头与论文中引用的类似,但在每次卷积之后都通过额外的 BatchNorm 层进行了增强。
示例
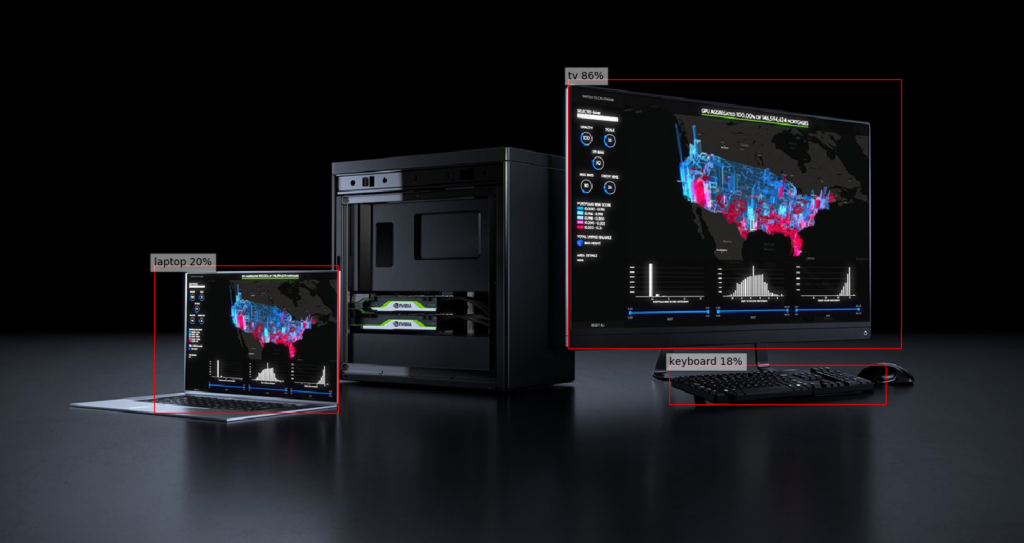
在下面的示例中,我们将使用预训练的 SSD 模型来检测样本图像中的物体并可视化结果。
要运行此示例,您需要安装一些额外的 Python 包。这些包用于图像预处理和可视化。
pip install numpy scipy scikit-image matplotlib
加载在 COCO 数据集上预训练的 SSD 模型,以及一组用于方便和全面格式化模型输入和输出的实用方法。
import torch
ssd_model = torch.hub.load('NVIDIA/DeepLearningExamples:torchhub', 'nvidia_ssd')
utils = torch.hub.load('NVIDIA/DeepLearningExamples:torchhub', 'nvidia_ssd_processing_utils')
现在,准备加载的模型进行推理。
ssd_model.to('cuda')
ssd_model.eval()
准备用于物体检测的输入图像。(下面的示例链接对应于 COCO 数据集中的前几张测试图像,但您也可以在此处指定本地图像的路径)
uris = [
    'http://images.cocodataset.org/val2017/000000397133.jpg',
    'http://images.cocodataset.org/val2017/000000037777.jpg',
    'http://images.cocodataset.org/val2017/000000252219.jpg'
]
格式化图像以符合网络输入并将其转换为张量。
inputs = [utils.prepare_input(uri) for uri in uris]
tensor = utils.prepare_tensor(inputs)
运行 SSD 网络以执行物体检测。
with torch.no_grad():
    detections_batch = ssd_model(tensor)
默认情况下,每个输入图像的 SSD 网络的原始输出包含 8732 个带有定位和类概率分布的框。让我们过滤此输出,以更全面的格式只获取合理的检测(置信度>40%)。
results_per_input = utils.decode_results(detections_batch)
best_results_per_input = [utils.pick_best(results, 0.40) for results in results_per_input]
该模型在 COCO 数据集上训练,我们需要访问该数据集才能将类 ID 转换为物体名称。首次下载注释可能需要一些时间。
classes_to_labels = utils.get_coco_object_dictionary()
最后,让我们可视化我们的检测结果。
from matplotlib import pyplot as plt
import matplotlib.patches as patches

for image_idx in range(len(best_results_per_input)):
    fig, ax = plt.subplots(1)
    # Show original, denormalized image...
    image = inputs[image_idx] / 2 + 0.5
    ax.imshow(image)
    # ...with detections
    bboxes, classes, confidences = best_results_per_input[image_idx]
    for idx in range(len(bboxes)):
        left, bot, right, top = bboxes[idx]
        x, y, w, h = [val * 300 for val in [left, bot, right - left, top - bot]]
        rect = patches.Rectangle((x, y), w, h, linewidth=1, edgecolor='r', facecolor='none')
        ax.add_patch(rect)
        ax.text(x, y, "{} {:.0f}%".format(classes_to_labels[classes[idx] - 1], confidences[idx]*100), bbox=dict(facecolor='white', alpha=0.5))
plt.show()
详情
有关模型输入和输出、训练配方、推理和性能的详细信息,请访问:github 和/或 NGC
参考文献
